What Should Be Included in Your SnapCharT® Diagram?

Advanced SnapCharT® Knowledge
Beginners often ask questions about what information should be included in their SnapCharT® Diagrams. This is NOT a basic question. It took us years to figure out the answer by performing and reviewing thousands of SnapCharT® Diagrams. So read on to learn from our experience.
Four Levels of Detail
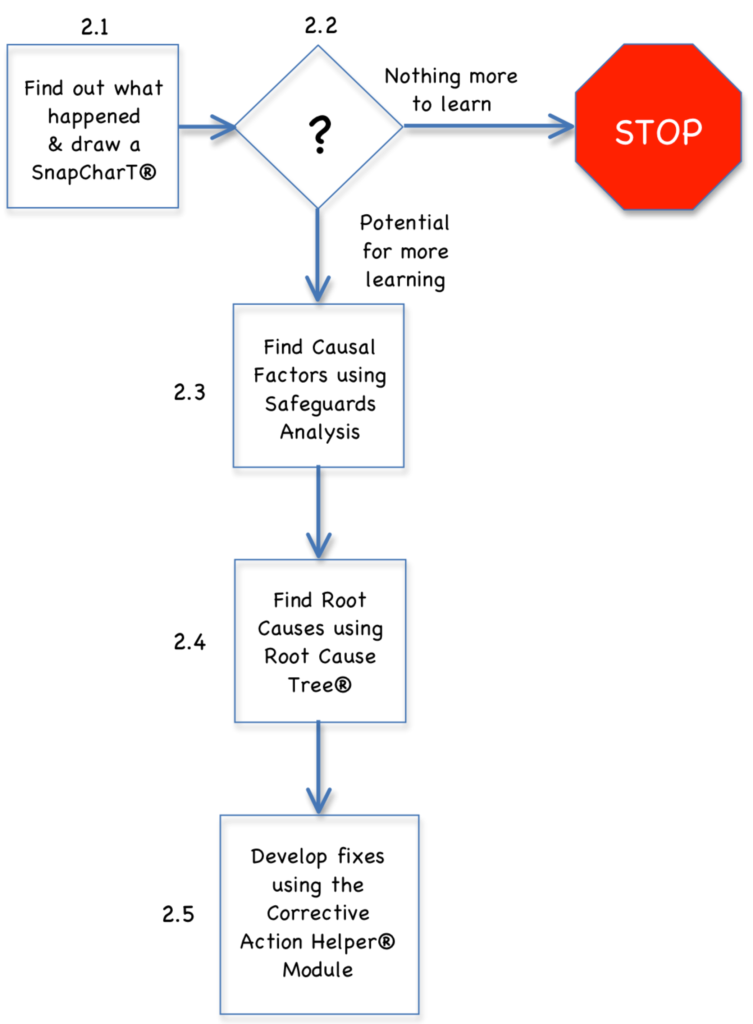
The answer to how much detail you need in a SnapCharT® Diagram depends on what you are using your SnapCharT® Diagram for. In general, there are four basic uses of a SnapCharT® Diagram that are based on where in the TapRooT® Process (simple investigation process shown below) you are working.

Just Enough to Decide to Continue (or Not)
2.2 on the graphic above is the point that you decide – using the information in your SnapCharT® Diagram – if you need to continue with your investigation or if you would be wasting your time to continue.
To make this decision, you need to understand:
- The basics of what happened.
- The potential for the outcome of the incident to be worse.
- Anything unusual that happened that needs more investigation because it might result in a more serious incident.
A very simple SnapCharT® Diagram to make that decision is shown below.

This SnapCharT® Diagram shows that this was a fairly simple incident – a sprained ankle. However, there are a couple of things that may be worth looking into in more detail. First, why were the parking lot lights out? The lights being out could result in other incidents (someone being hit by a car in the dark).
Second, the pothole had been reported four weeks ago, and no action had been taken. Delayed maintenance on a safety issue could potentially cause a more serious incident.
Therefore, there is just enough information in this simple, early SnapCharT® Diagram to decide that this investigation should continue.
Identify Causal Factors

Above is a SnapCharT® for the Sprained Ankle Incident that is getting close to having enough information to develop Causal Factors. The investigator would use the Safety Causal Factor Worksheet to identify all the potential Causal Factors and, perhaps, re-arrange the SnapCharT® to make it more logical. But even with this slightly disorganized SnapCharT®, you can see that as the investigation progresses, additional detail is added to the diagram, and all the mistakes, errors, or equipment failures are now included on the diagram.
Information About Each Causal Factor

Above is the SnapCharT® Diagram with all the Causal Factors identified and the information we could collect about each Causal Factor. The information about each Causal Factor helps the investigator analyze each Causal Factor using the Root Cause Tree® Diagram (the top of page one of the diagram shown below).

What kind of information? Well, if it were a Human Performance Difficulty, the investigator would need to have the information needed to answer the 15 questions in the Human Performance Troubleshooting Guide and the questions in the Root Cause Tree® Dictionary for the indicated Basic Cause Categories.
If you don’t have that information, the investigator may need to dig deeper, or they may not be able to identify all the root causes.
Management Presentation

Almost all investigations require the investigator to present what they have found to management for approval of the investigation and approval of the corrective actions. If you have been to TapRooT® Training, you know that this SnapCharT® should be simple but must have the information needed to explain what happened and why (the root causes of the Causal Factors) the incident happened. This helps justify the Corrective Actions.
In this simple incident, the investigator may be able to use the SnapCharT® with the Causal Factors for their management presentation. In more complex incidents, the investigator may start with a SnapCharT® that displays the sequence of events and then show the sequence with the Causal Factors. Finally, they would show the information collected for each Causal Factor and the root causes that were identified and the corrective actions that are recommended.
Find Out More About Advanced
Root Cause Analysis
If you have already attended the 2-Day TapRooT® Root Cause Analysis Training, you may want to attend the 5-Day TapRooT® Advanced Root Cause Analysis Team Leader Training. CLICK HERE for the dates and locations of our public 5-Day TapRooT® Courses being held worldwide. Or schedule training at your site by CONTACTING US.
Also, consider attending the 2024 Globsl TapRooT® Summit being held near Austin, Texas, on May 1-3. The Improving Investigations & RCA Track has a session on Wednesday that teaches advanced SnapCharT® Diagram techniques in a SnapCharT® Diagram exercise where you will draw a SnapCharT® Diagram for a major accident. This exercise will help both inexperienced and experienced TapRooT® Users develop better SnapCharT® Diagrams and improve their root cause analysis.
Get more information about the track HERE.


Comments about this standard training model:
Some events are shown as conditions which can cause confusion in new users of TapRoot
There is an event that occurs between the time the person steps in the hole and the ankle sprain that should be explored.
Additional events are not listed
There were events preceding the lights going out that are not shown in a timeline
There was a time between the asphalt failing and the pot hole forming that is not shown
There was a time when trucks began using the parking lot for access and the asphalt failing.
When event lines provide finer detail, conditions have a logical location for placement on the chart.
It also will produce a more complete list of causal factors for analysis
John – Good comments.
Much that could be discussed in making a perfect SnapCharT® Diagram.
Luckily. SnapCharT® Diagrams don’t have to be perfect to accomplish their purpose – especially for a simple incident.
Versatile incident investigation tool…
1) verified facts in sequence of event
2) clarity in finding causal factor
3) dive deeper to find root cause for causal factor
4) action to address root cause
5) tracking the effect / no repeat incident